eduPostal delivers the most comprehensive, easy-to-use direct mail analytics of any tool available. Imagine knowing precisely the delivery and response status of each postcard or letter you send. All of it rolled up into valuable metrics to help pinpoint what works and doesn’t.
eduPostal tells you what’s happening in real-time after you send your mail.
“Home” in eduPostal is where your direct mail analytics begin. The Home page is a dashboard that rolls up all of the mailings you’ve done into several charts and graphs that provide insight into what campaigns have been sent, the delivery and response status of your mail, and how your various campaigns have impacted your conversion goals.
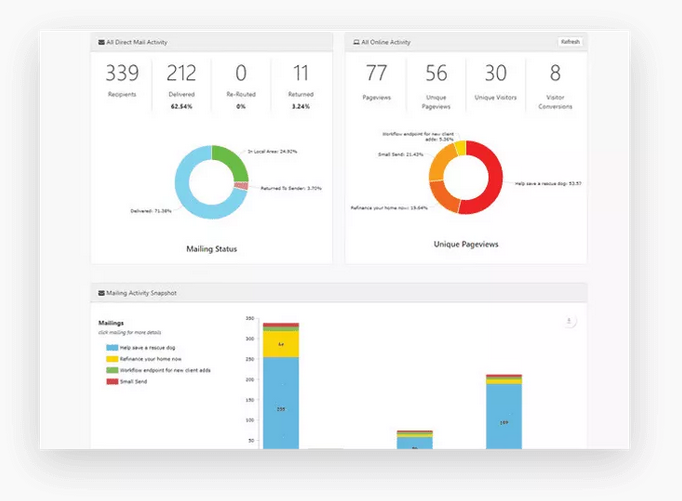
You also get very detailed campaign-specific dashboards in eduPostal.
Click “Campaigns” and “View Campaigns” on the top navigation menu.
Click on the “Hamburger Menu” for the campaign (shown below) or for a specific mail drop within a campaign.
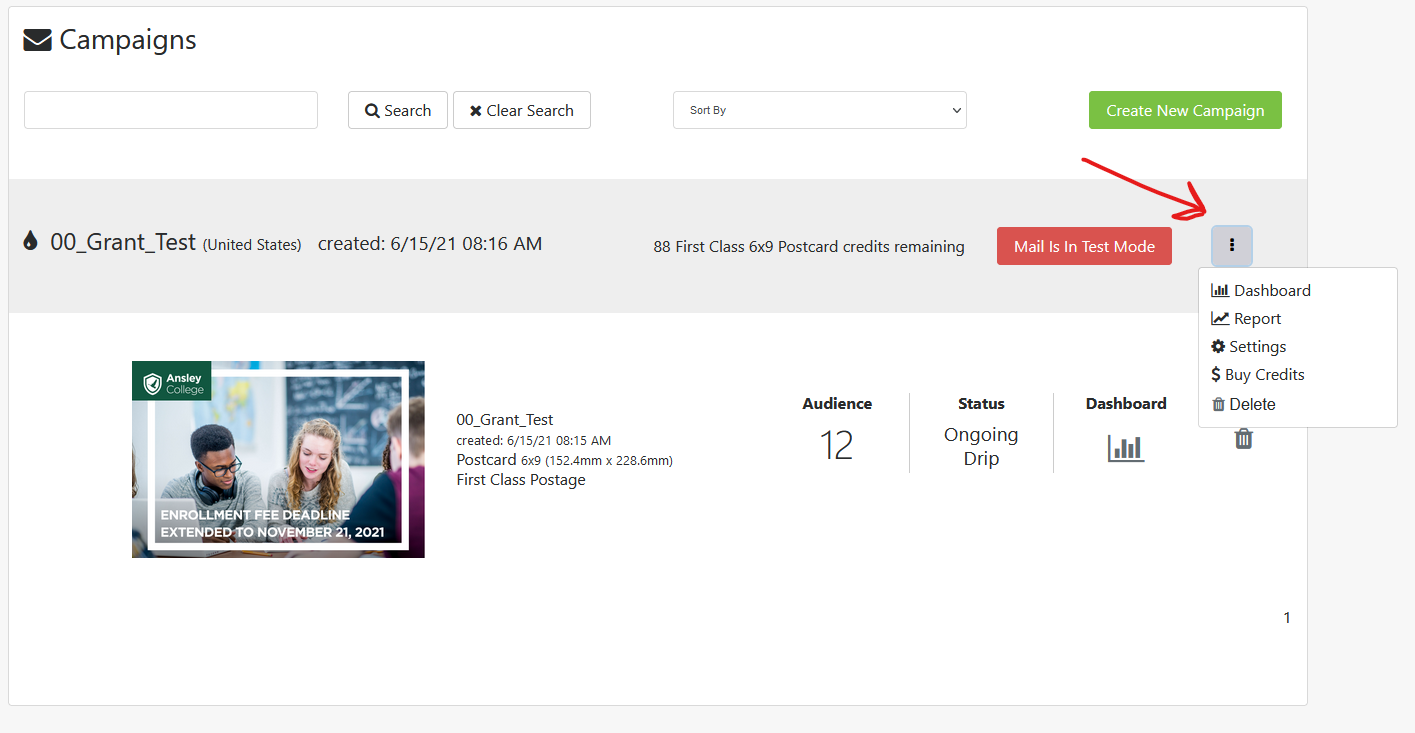
When you access a campaign dashboard, you’ll be able to drill into an incredible amount of real time data about your campaign. For more information, see the “Understanding Your Campaign Dashboard” article.