The Campaign Dashboard is the control panel for analyzing and managing your direct mail campaign after it is sent. It captures all the delivery information that USPS and Canada Post can track.
If your campaign utilizes free Personalized URLs from eduPostal, the online response to the campaign is followed. From the dashboard, you can manage all the elements of your campaign, including campaign events and goals, visitor and page reports, and download pURLs.
Access Your Direct Mail Campaign Dashboard
From campaigns, click on the Dashboard icon of the campaign you’d like to review:

To enter the Campaign Dashboard, select your campaign from the "View Campaigns" selection in the top menu in eduPostal. You can either click the Dashboard icon or the "Hamburger menu" and choose Dashboard.
The Top Panel – Campaign Info & Delivery Data – U.S. Mailings
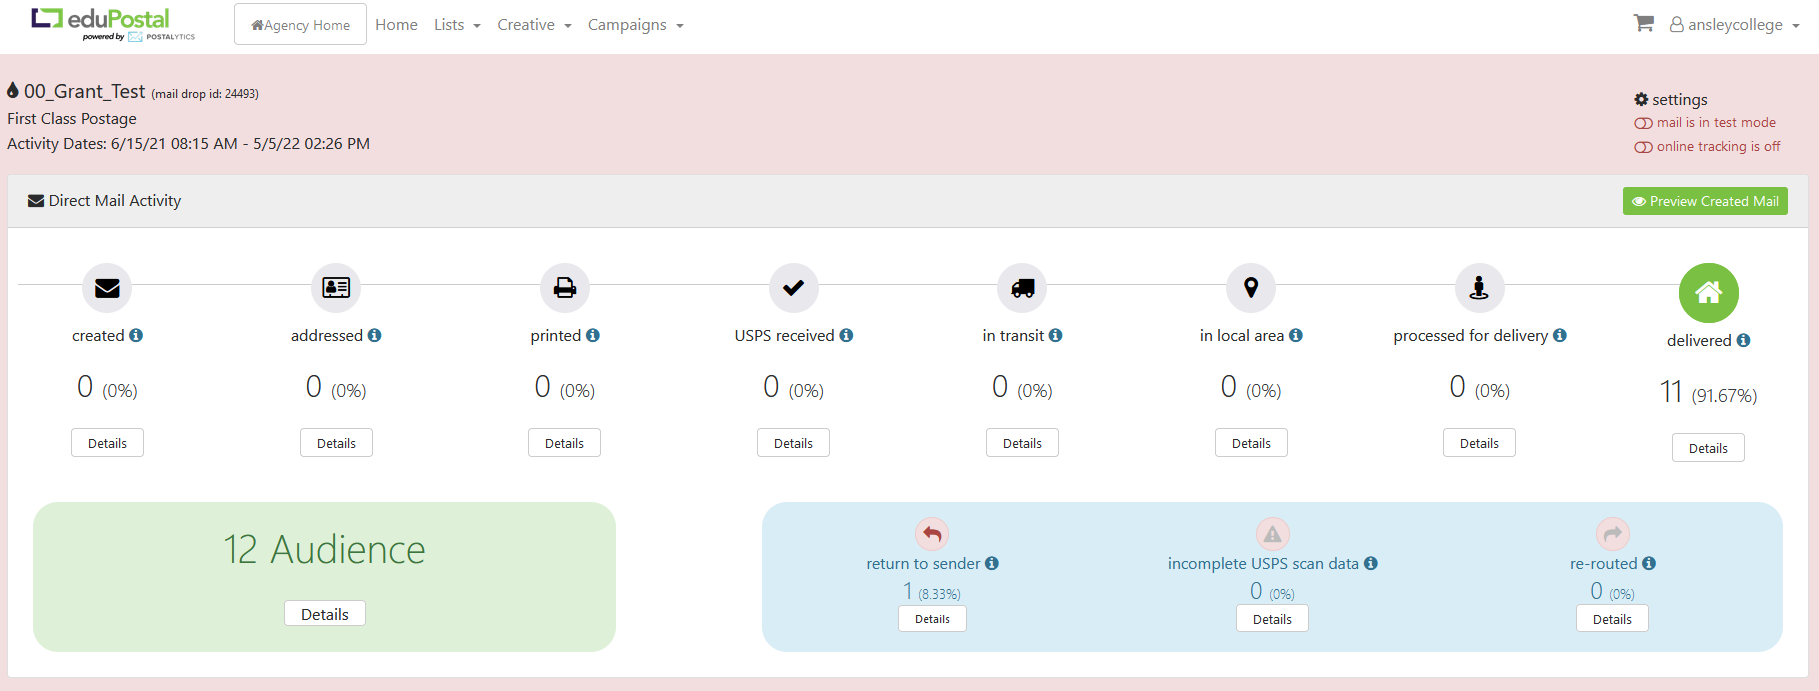

Starting on the left, you’ll see the name of your campaign, preceded by a Mail (Smart Send) or Drip (Triggered Drip) symbol to remind of the type of campaign you’re looking at. You’ll also see the “mail drop id“, which you’ll need if you’re planning to do multi-channel campaigns with HubSpot, Salesforce or other CRM/Marketing Automation tools.
The right hand side of the top panel gives you a link to the campaign settings page (where you can modify/update important settings), as well as toggles to turn on or off online tracking (if your campaign is using pURLs) and mail “Test Mode” for Triggered Drip Campaigns.
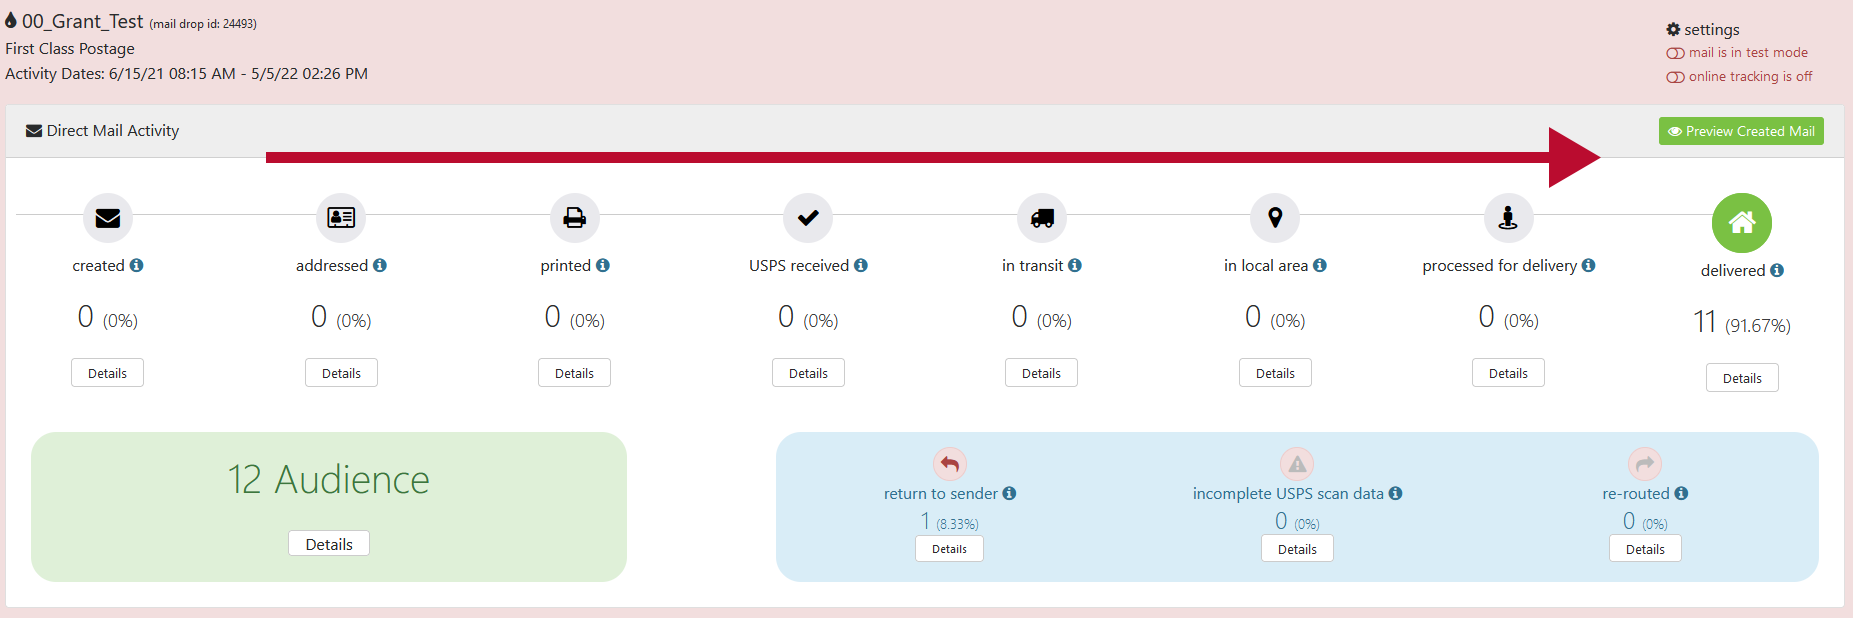
The Direct Mail Activity panel can give you a preview of your created mail (upper right hand corner) along with detailed information about the current status of the delivery of each of your mailpieces.
Preview Created Mail – view, search or download a .PDF of each mailpiece created for this campaign.
Audience – This figure represents the number of mailpieces created for this campaign. Click the details button to jump to a list of each recipient in the “Offline Audience” panel.
Delivery Status Codes* – this tells you, at any given point of time, how your mail is being categorized during the delivery process. Starting with “Created” and ending with “Delivered” and other final statuses, you can now understand exactly what is happening with your mail delivery. You can mouse over the information icons to get definitions of each status.
*Note: Delivery Status Codes are not available for Canadian Campaign Dashboards.
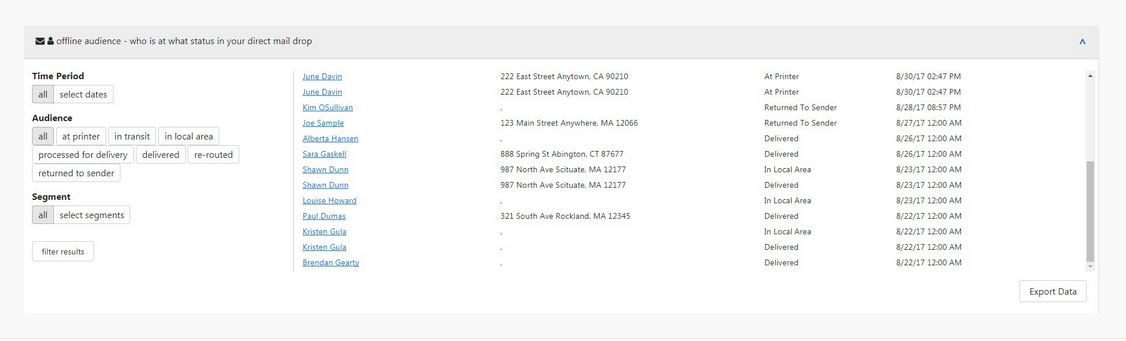
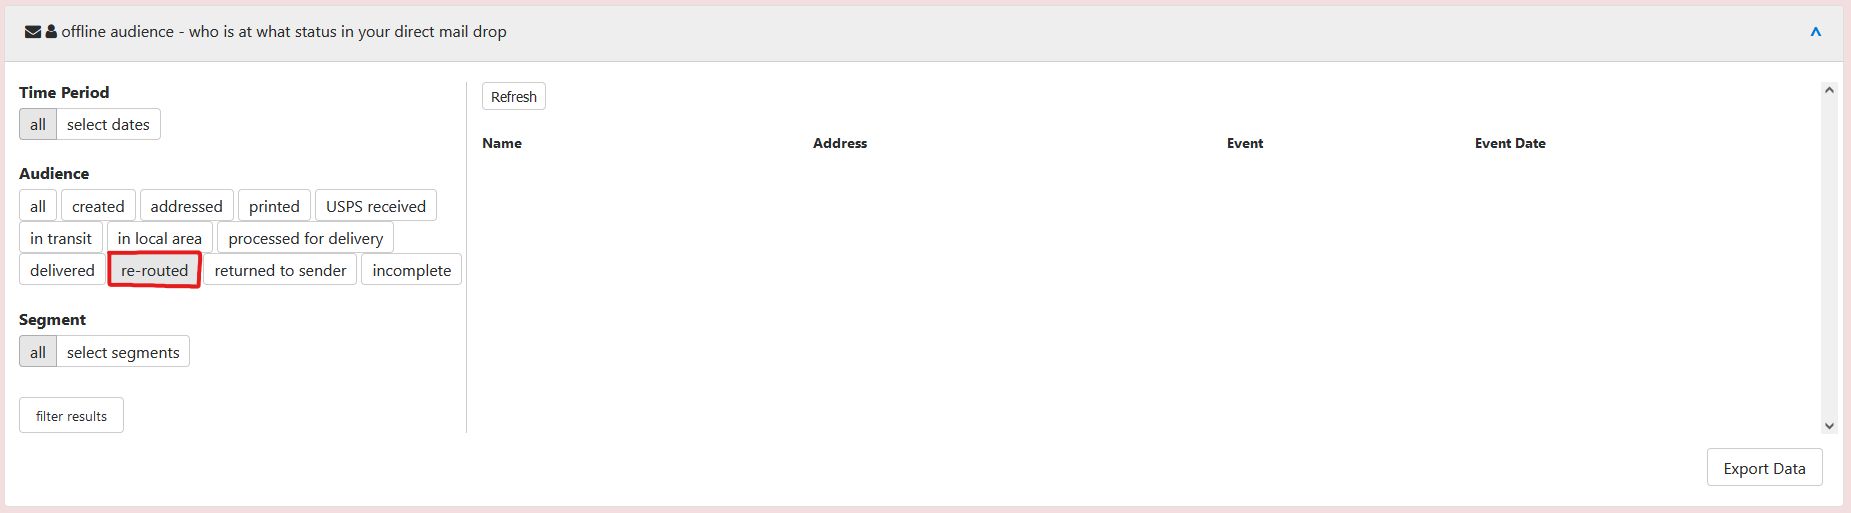
If you select Details for any of these delivery statuses you will be brought to the Offline Audience report.
The Detail button you select will brought you to this report preconfigured for that delivery status. The example below is when Details was selected for Re-Routed. You can also export all of the data into a .CSV file for offline modification.
Contact List Health Panel

Scrolling down on the left side, the Contact List Health panel will provide detailed information about the mailing status of contact data used in the campaign. In addition to the list name and the number of campaigns the list has been used in, you’ll be able to get a quick snapshot of:
Total Valid and Invalid Contacts – The aggregate number of contacts that have been marked as “Invalid” (not to mailed to) based upon the import validation and campaign data (Return to Sender, Re-Route status) gathered for this list for all campaigns it has been used in.
Invalid Stats Gathered From Campaign Activity – Further detail on the Re-Routed and Return To Sender scans that each campaign this list has been used in has gathered. These contacts are marked “Invalid” in your list.
Contact Records With Field Issues – shows you the number of invalid fields captured during the import process of the contacts. A single contact may have more than one issue.
Online Activity Panel

To the right of the Contact List Health, you’ll find the Online Activity Panel. If you’ve used the free Personalized URL tools that enable you to track your online response, this panel is for you.
Download Audience Including pURLs – Click here to download a .CSV file with your entire audience, the data that you mapped into eduPostal and the pURLs for each of your audience members.
Unique Visitors and Visitor Conversions – The figures and chart will show you how many unique (individual rather than repeated) visits and conversions your pURLs have gotten over the course of the campaign. Conversion data is measured by the number of unique audience members that reached the “Goal URL” that you defined in the campaign. You can click on the “Details” buttons to jump to detailed lists of each in the online audience panel further down the page.
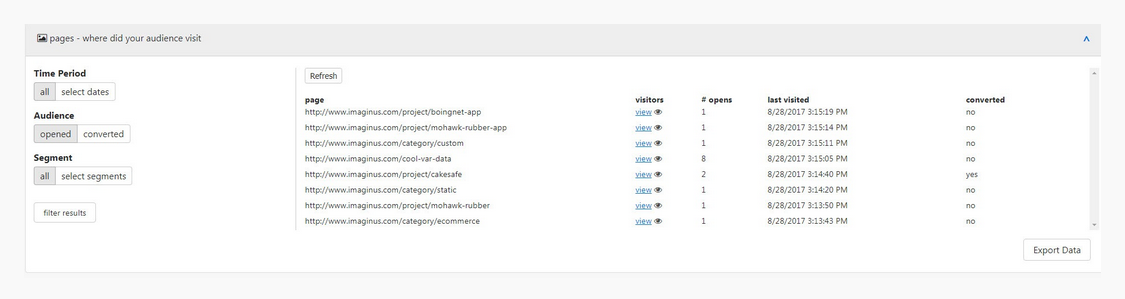
Page Views and Unique Page Views – show you the total number of pages visited by your audience and the unique (not repeated) page views. Again, click the Details button to jump to a detailed listing.
eduPostal provides a variety of methods to download or save reporting information.
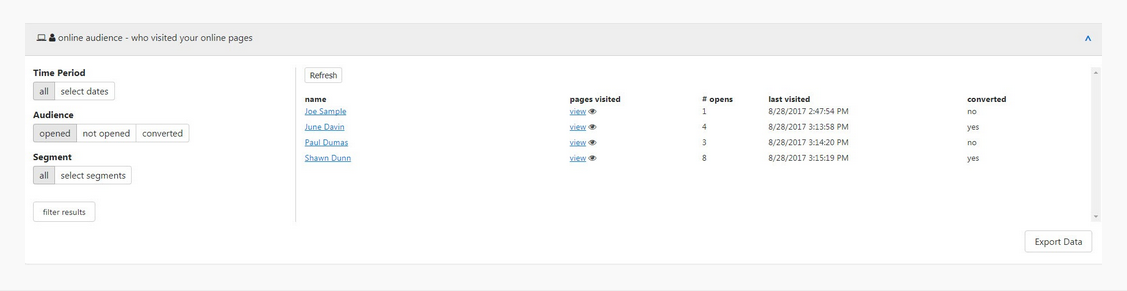
If you select Details for any of these online statuses you will be brought to the Online Audience or Pages report. The example below is when Details was selected for Visitor Conversions. You can also export all of the data into a .CSV file for offline analysis.
Direct Mail Timeline*
*Note: This area does not apply to Canadian Campaign Dashboards
It shows the status of the delivery status for this specific campaign by date. You have the option to have to include or exclude one of the variables in the report by clicking on the icon below the results grid.

Online Activity Timeline
This report provides all online activity details for opens, unique page opens, conversion and unique visitors by day.
You have the option to have to include or exclude one of the online variables in the report by clicking on the variable in results grid.

Offline to Online Flow
This funnel report shows the total number of direct mail recipients, delivered and unique online visits for this specific campaign. The funnel chart provides a good visual illustration of how a campaign is performing over the various steps.

Offline to Online Stats
This report highlights key offline to online stats: the percentage of delivered mail to online visit rate, delivered mail online conversion rate, average days between direct mail send and online opens and average days between direct mail send and online conversions.

Conversion Goals
For a specific campaign, You can select Conversion Goals and confirm, add or adjust the conversion goal URL. Click on the Pen and Pad icon to the right of the goal to make an adjustment or select add campaign goal.

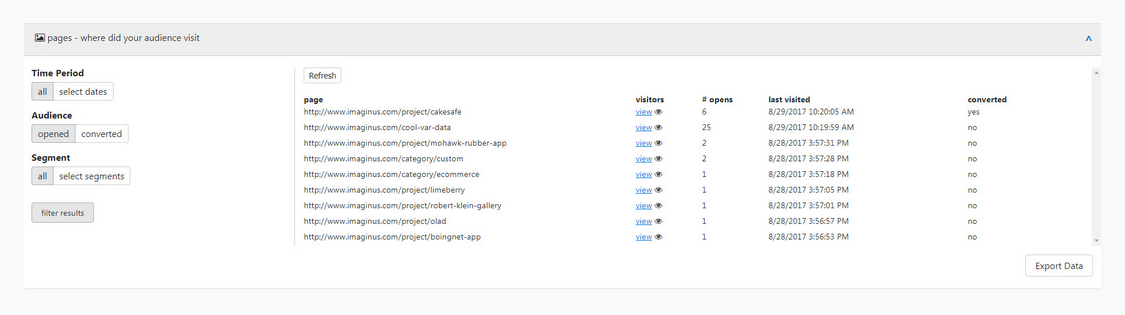
Audience and Page Reports
The Offline Audience, Online Audience and Pages reports provide detailed listings of the audience members that meet the criteria you establish. These panels provide configurable views of the behavior of the targets of your Audiences campaign, both as unique targets as well as at the page level.
The left side of the panel controls the display. Simply choose the segmentation you’d like to see and click “filter results” to modify the view. You can also export all of the data into a .CSV file for storage and offline analysis.